
Juice Sucking Servers
On April 18, 2024 I gave a talk for the Appril Festival at Pinch for their ‘Sustainable Internet’ talks. This is a blog post of that talk.
A follow up post with faster swift benchmark appears in part deux
A follow up post where the measurements are done with a patched version of wrk appears in part trois This also has a better memory overview graph.
Introduction
After server energy bills doubled in the last year, I started investigating how to mitigate those costs. In this post I will discuss resources needed for different backend technologies, like Node.js/javascript, php, java and the newcomer vapor/swift.
I created four different Docker environments and ran benchmarks while measuring the server’s power consumption. I will show at what loads the different technologies fail, and what that means for server deployment. The used benchmark code is in this serverbench repository.
The Cloud
So, why is energy conservering important? Everyone hosts their servers in the mythical ‘cloud’, right? Thus delegating responsibility for server maintenance, but which also means you simply get the bill for using more resources without knowing why.

Hardware
Since 2001 I have been running my own servers. Since 2008 I do this at the ColoClue association. I have my own hardware and they have great peering arrangements and connectivity. They also measure your server’s power usage, so every member pays what it is using.

I became more interested in the power-performance ratio of my server, when one of the data centers raised their electricity prices last year by 50%, and were warning to do the same this year. Suddenly the hobby became €€€ expensive €€€. When my old server from 2013 was due for an upgrade, I had a server at home to play around with.
Measuring power consumption
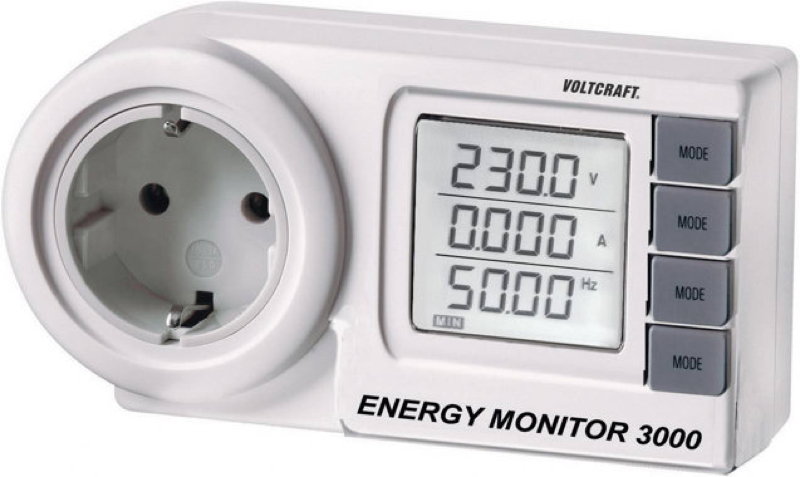
To measure the power usage of the server, I first used an old energy monitor.
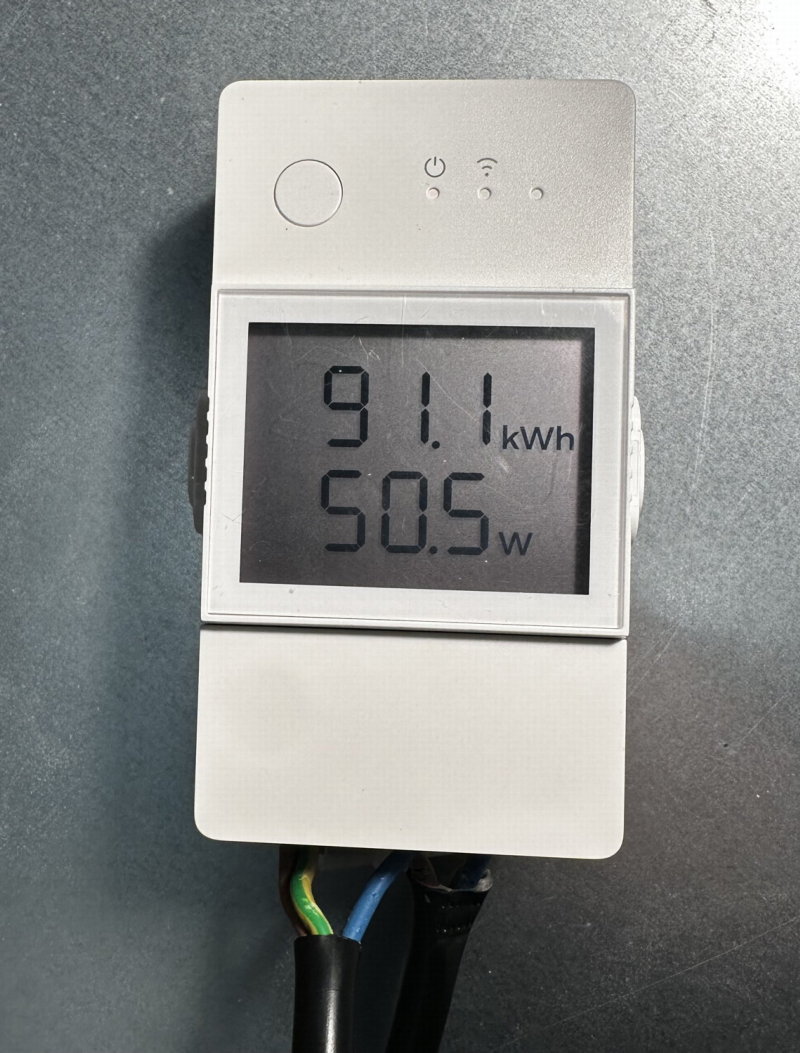
But when I started to automate my benchmark tests with scripts, I used a Sonoff POWR316D. And because I do not want my measurements to end up on Chinese servers, I reflashed it using the open source Tasmota firmware. Now I can point the power measurements periodically to my own data collector. I used the MQTT protocol and saved it to a simple CSV file using Node-Red. This CSV file can be imported in any spreadsheet to make graphs.
Fans
The first thing I noticed, was that it makes a huge difference if the fans are going full-tilt, as is often the case in data centers, or if they are off. They could be off if the server is idling. The difference in power usage between idling and full-fans is about double for this server!
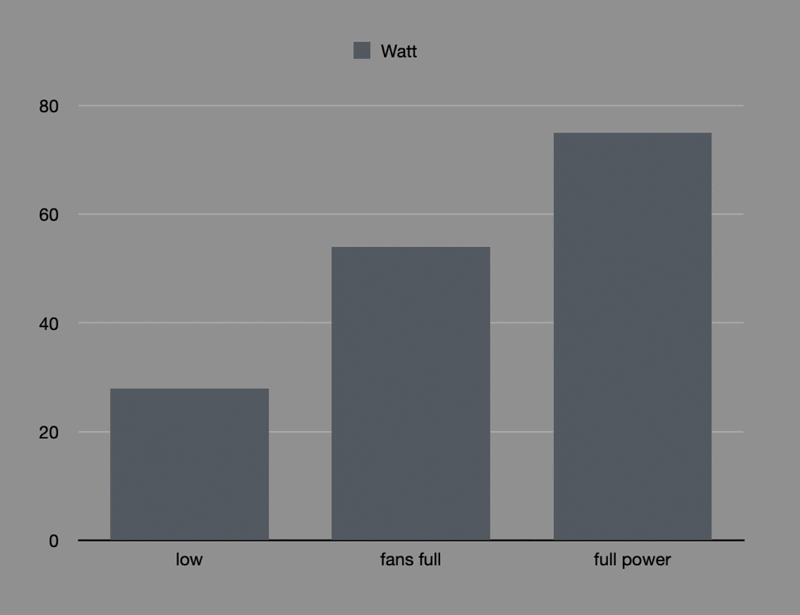
- fans off ➔ 28W
- on ➔ 54W ➔ double!
- in demand ➔ 78W
Because a server makes a hell-of-a-lot of noise, I keep the fan speed as slow as possible at home. For that I am using the linux software ‘lm-sensors’ in combination with ‘fancontrol’. It detects all the temperature sensors and fans on your server after some handholding. Then you can create a config file to feed to a fancontrol service.
So, this already helps some to reduce the power used by my server. But what about the software packages and websites I am running?
Software
How can we measure the efficiency of the web-software used? Loading a web page works as follows: The browser does requests, and receives responses.
There are some things you can measure, for example:
- The speed at which a server responds (latency)
- The load a server can handle, i.e. the number of concurrent requests before it times out
- The number of timeouts
Now, to benchmark a server we do hundreds or thousands of requests per second. If we do not get a response within a reasonable time, we declare it as a failure, or timeout.
Benchmarking software
At first I started to use ApacheBench (ab) because I knew it already and is a veteran. Apache is one of the most used webservers, but nowadays nginx is faster and getting more popular.
ab works by doing a pre-specified number of requests to the server. But ab also gave spurious errors at very high request rates. Nor does it support the HTTP/1.1 ‘keep-alive’ protocol, which speeds up the communications by increasing re-use of connections.
So I diverted to using wrk, which is a more modern http benchmarking tool. This works by specifying the maximum duration a test should take, and it crams a maximum number of concurrent requests to the server.
The goal is to keep all CPU cores 100% busy all the time.
Efficiency
For my benchmarks I chose the most prolific web server languages and frameworks:
- javascript with Node.js
- php
- java
Because I am an iOS and Mac developer by trade, I also wanted to see how the web framework swift with vapor compared.
So how can we measure efficiency? We need an application that we can benchmark. I wanted:
- an algorithm which exercises the cpu
- low-bandwidth requirements, because we’re measuring languages, not networking
- no database
- i.e. a ‘pure function’: input ➔ output
Fibonacci
I decided upon the Fibonacci sequence. This takes some time, and can be made longer by requesting a higher number. As a reminder:
- You start the sequence with 0 and 1;
- then for each n, you calculate (n-2) + (n-1);
- this gives the sequence 0 ➔ 1 ➔ 1 ➔ 2 ➔ 3 ➔ 5 ➔ 8 ➔ 13 ➔ … ➔
The Fibonacci sequence occurs a lot in nature!

Disclaimer
I am not a pro web developer!
I don’t know javascript, php or java at a good enough level to write a performant application. Luckily, I had ChatGPT and friends to help me!
ChatGPT created the Node.js and php applications, and a member of ColoClue created the java version. Another member helped me getting the php version more optimised using php-fpm. The vapor/swift application I built myself.
By default, Node.js and php only run in one thread. Which means that it only runs on ~~> 1 CPU core! Java and vapor put all cores to use out of the box. For a fairer comparison, I figured out myself how to put Node.js behind nginx.
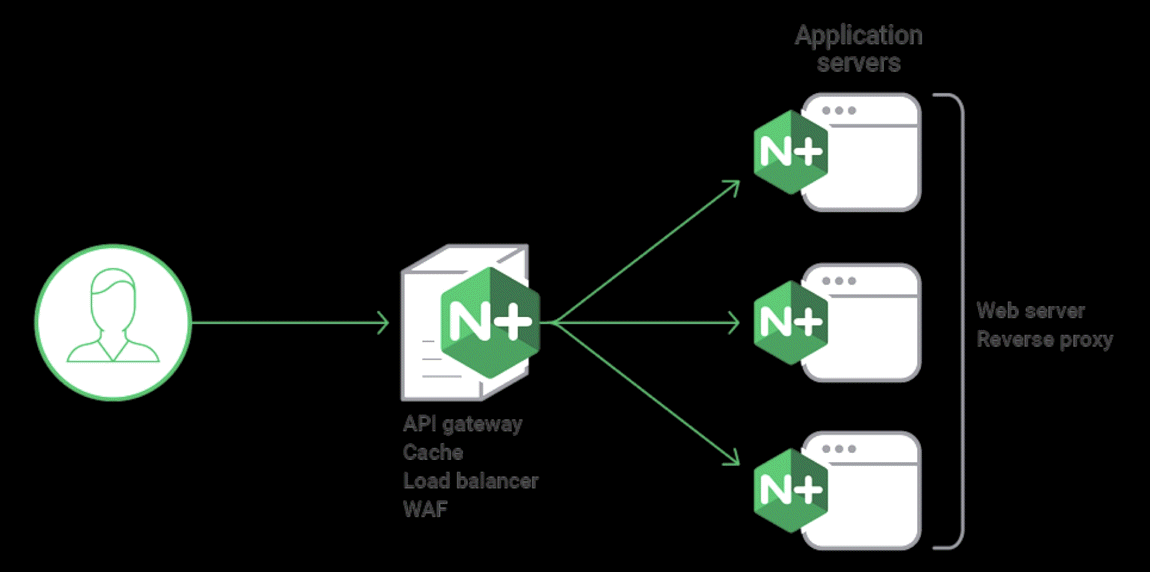
nginx: proxy & load-balancer
The web server nginx can also be deployed as a load balancer and proxy server, where it can distribute incoming requests to multiple backend server applications. This lets me distribute one url endpoint amongst multiple processes calculating the responses.
Measurements
Now we’re getting to the gist of this blog post, the benchmarks!
What we measure
We look for the maximum throughput the differents servers can sustain. If your server can only service half your workload, you need a second server to handle the full workload—and use more energy along the way.
While benchmarking we also measure the power consumption of the hardware, for later comparison.
Concurrent requests
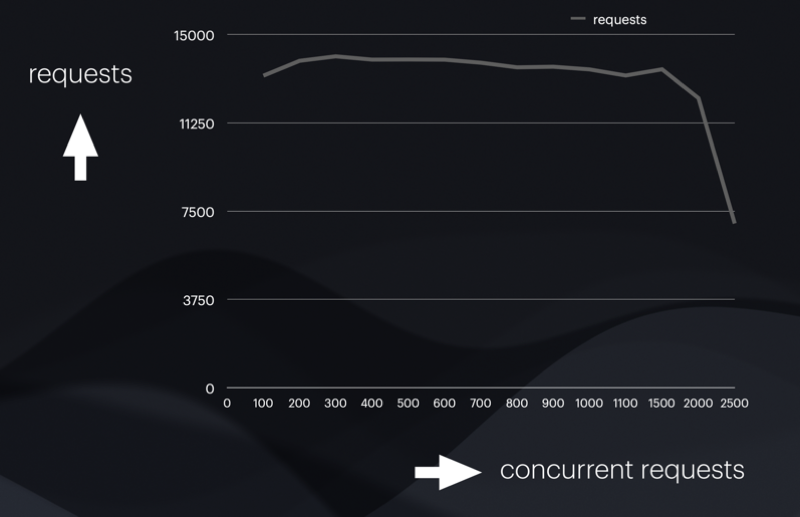
We measure the number of requests the server accepts for a given number of concurrent connections. One connection corresponds to one client.
In all the graphs below I ran 30-second tests. In the example below we can see this server can handle about 13500 requests from 300 clients.
Failures
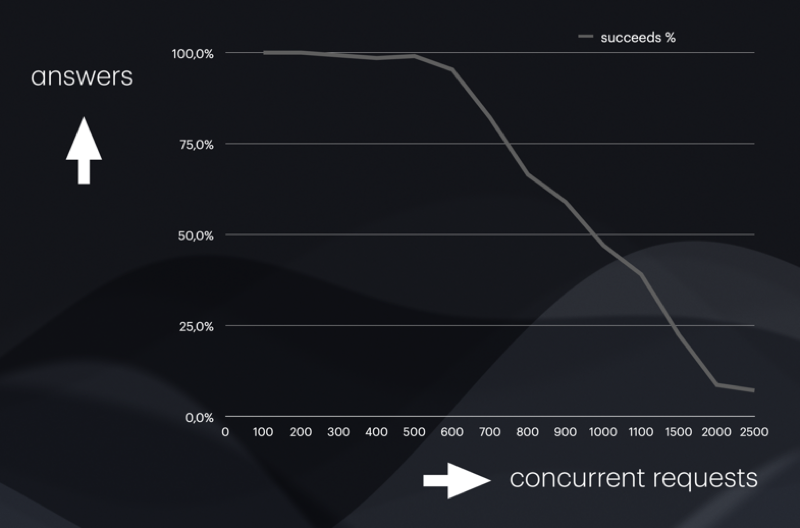
In the next graph you see at some point requests start failing. That is because wrk is configured to give up on a request if it doesn’t get a response within two seconds. Wrk then moves on to a new request, just like users hit reload when a website is unresponsive. The server however is still working on the first request. And so the work keeps piling up as the server cannot keep up.
What we see in the graph below, is that the number of timely responses starts dropping after 600 concurrent requests. The work piles up faster and faster, leading to a rapid collapse.
Comparisons
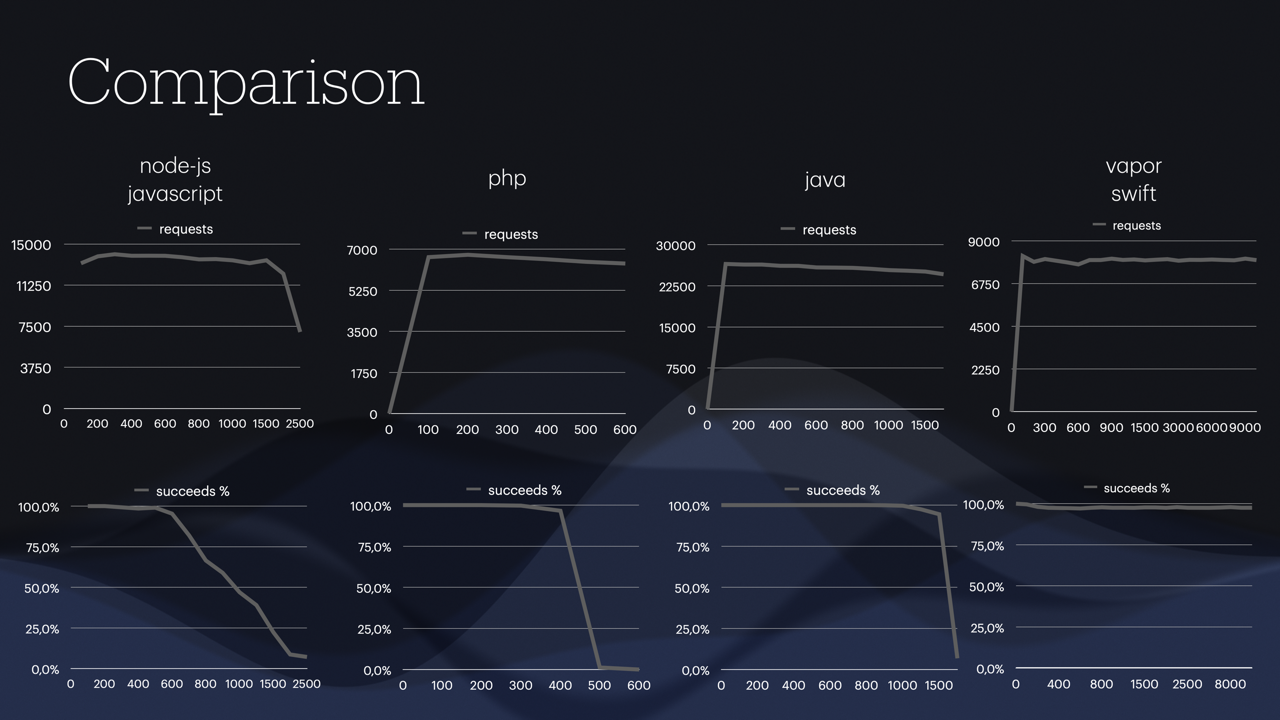
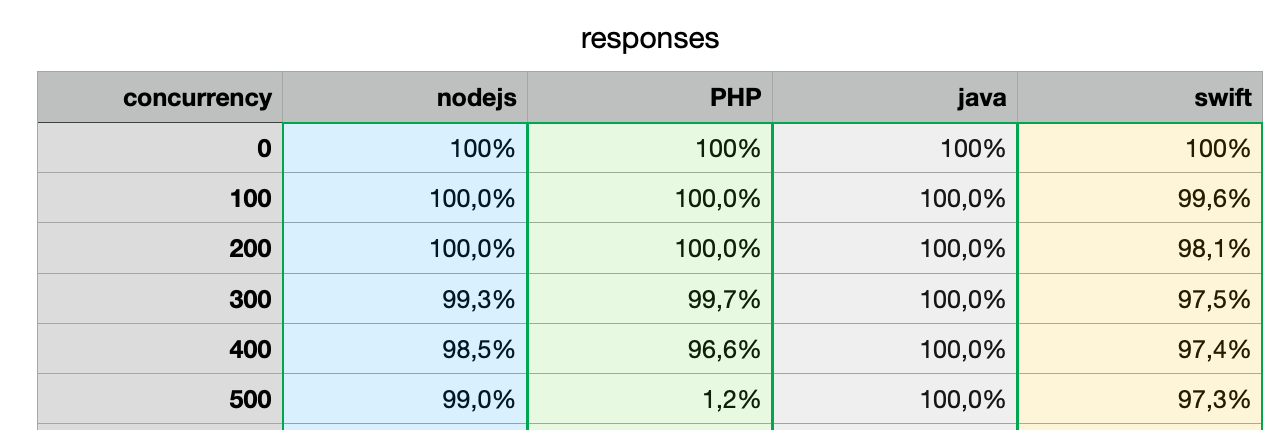
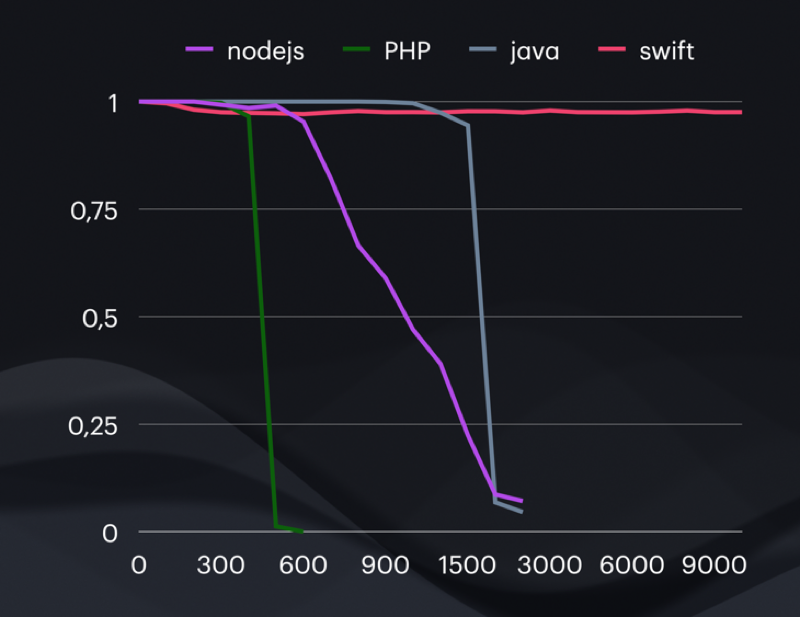
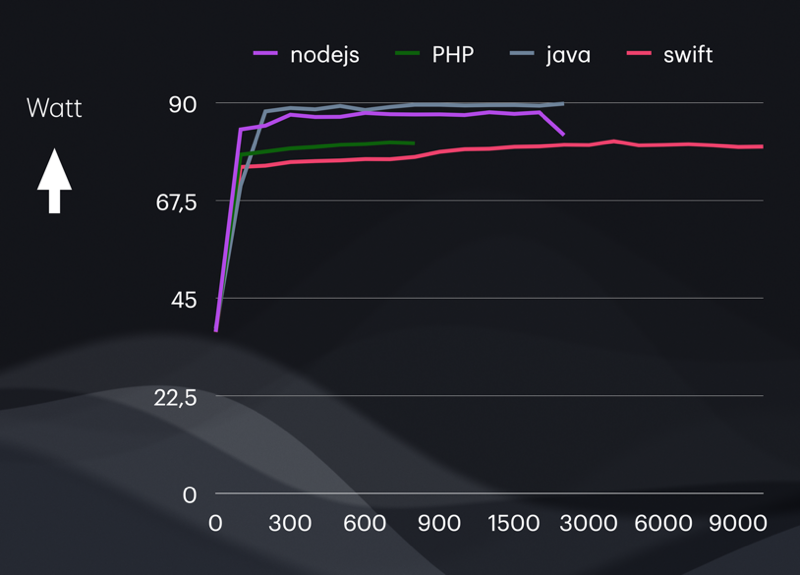
In this overview you see the number of requests at a certain number of concurrent connections, and when the drop-off occurs. Swift is a special case (and I do not know why yet!).
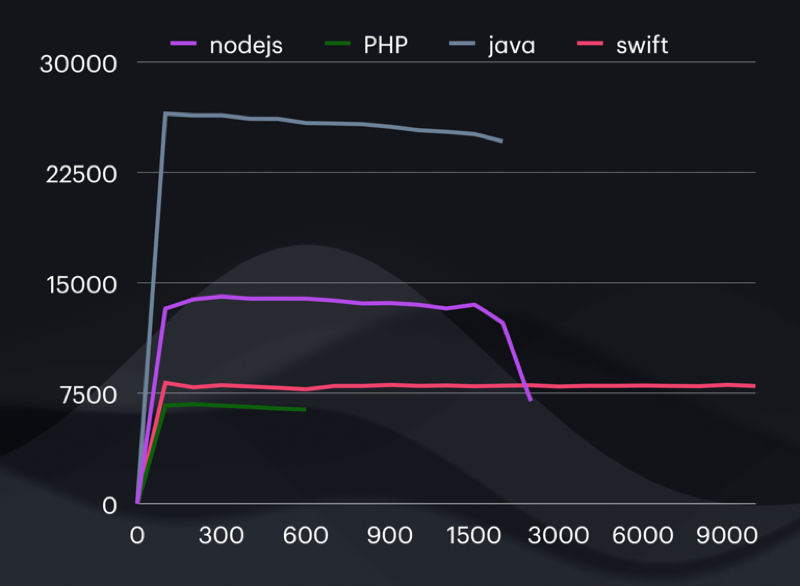
Because the graphs above all use differents scales, here are the same comparisons scaled in the same graph. What you see is that java and Node.js are much more responsive than swift and php at the lower end. Swift starts slower, but keeps on trucking. I will do measurements later at what concurrency swift will ‘break down’.
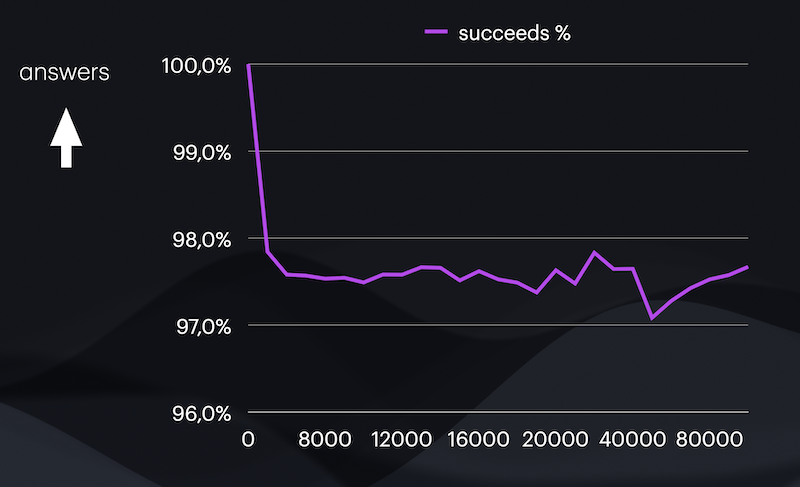
Another weird and as yet unexplained feature: If you look closely, you’ll see that swift never has a 100% success rate. It starts around 98% and stays there.
All the other applications start at a 100% success rate, and drop down when they can’t cope. Even with a measly 200 concurrent requests, swift drops 2% of the requests. I wonder why?
Also with the failures, we see that all frameworks but swift break down at some point. I stopped measuring swift at 10000 concurrent requests, but will update this blog post later for the higher rates.
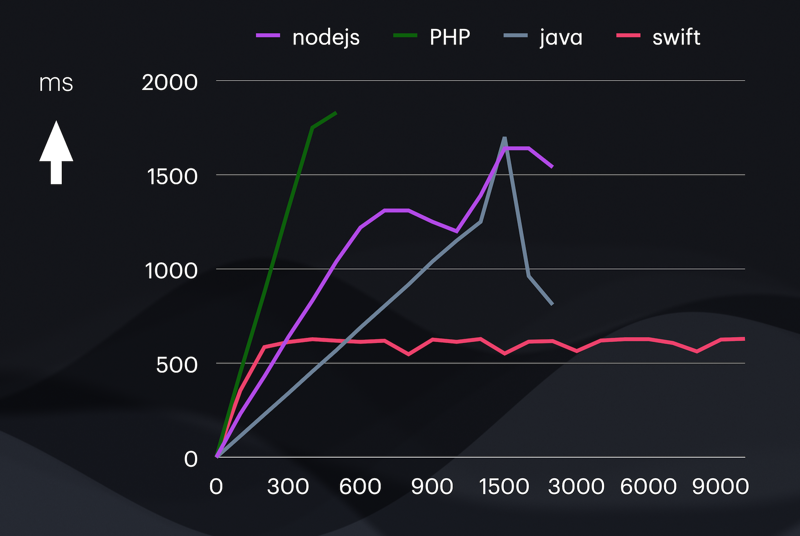
Latency
Here is the same data, but showing milli-seconds per request as opposed to requests per second. This is the time between issuing the request and receiving a response. Swift shows a strong consistency. I will test more intensively later.
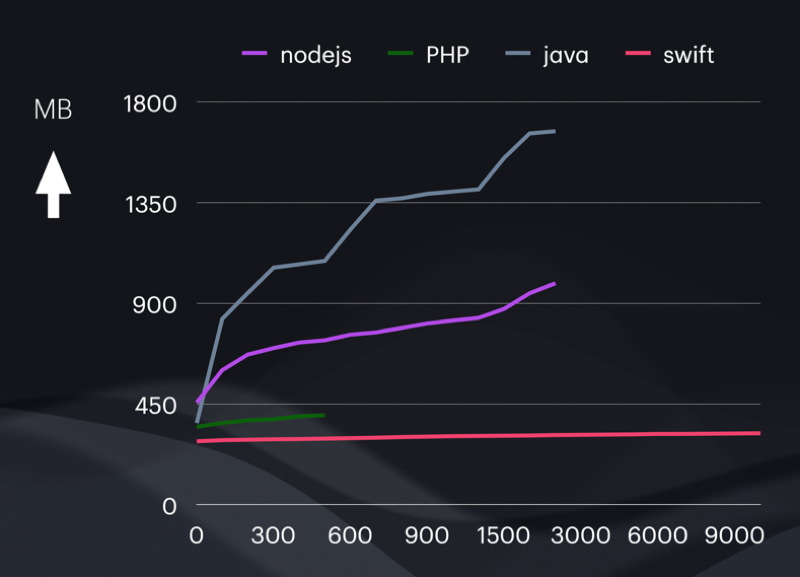
Memory
Memory usage varies a lot per technology
We see that javascript and java, being JIT (just in time compiled) languages need more and more memory to be performant at a higher level. The ‘kinks’ in the java graph are probably automatic garbage collecting by the java interpreter. Java seems to trade memory for speed. This might work out differently if there was a small delay between the requests instead of none at all. There is probably some threshold where java prioritises garbage collection over execution.
Swift meanwhile chugs along nicely without needing more memory, as the freeing of unused memory is more direct.
Power usage
We see the power usage goes up, but the amount of work done differs per tech.
Power consumption wise, there is not much difference. Power consumption ramps up with increased CPU usage. Swift needed approximately 11% less energy, but the others were more or less the same. I did not differentiate the energy for fans or CPU.
What is interesting though, is that this server could handle at least double the amount of requests in swift than in one of the more popular languages.
Swift
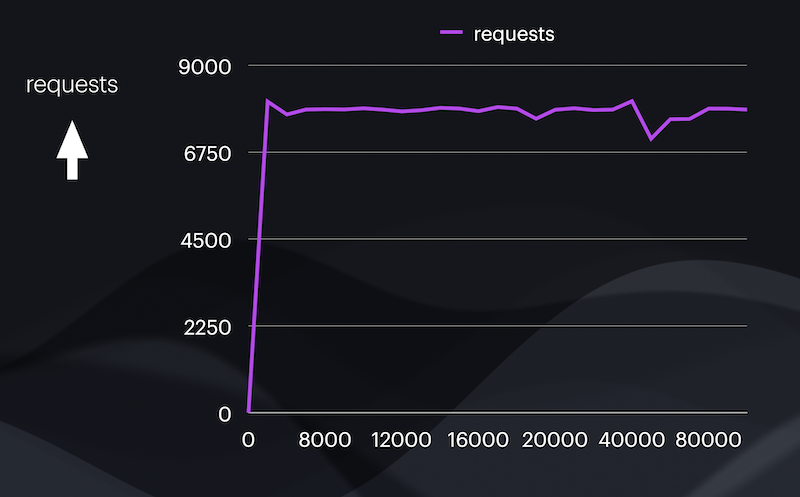
Swift seems an interesting anomaly. Where the other framework’s responses drop down due to excessive timeouts after a certain concurrency. Swift just seems to keep ongoing. I have no idea what the reason is for this. I decided to enlarge the maximum concurrent connections to a ridiculously high number: 100000. However, I don’t see any discrepancy. Perhaps my measurements are all wrong? I tested on older and newer hardware, see below.
It can still easily handle 100000 requests.
No apparent breakdown in timeouts as well, still the same 98%.
Newer hardware
Of course, newer hardware is more powerful and can handle more requests. The old server is an Intel Core i3-550 3200 server from 2013. The new one I bought in 2023 but the hardware seems from 2011 and it has an Intel® Xeon® D-2100 SoC. Newer processors optimise power management to reduce power consumption when CPUs are idle.
But that is a very complicated subject. For example, the old server runs 27W in idle, the new one around 80W.
How much more benchmarks it could handle I tested for java and swift. On the new server I started at 10000 concurrent requests, and went up to 100000.
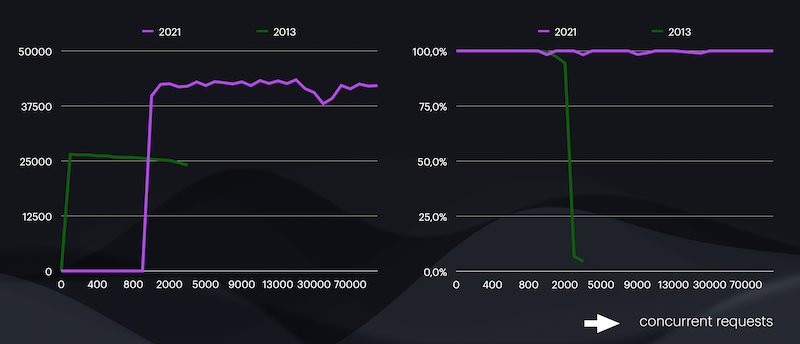
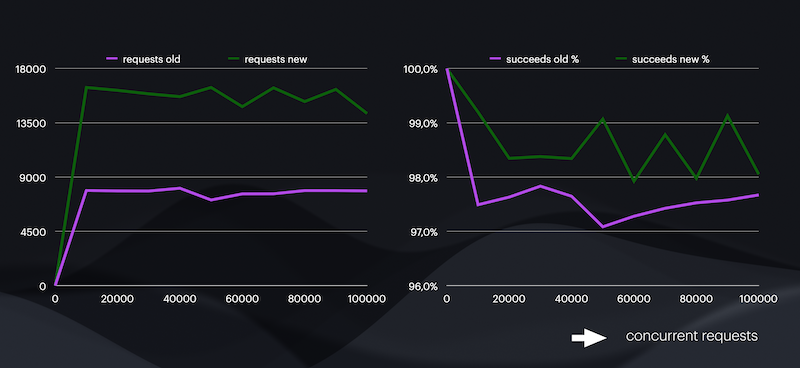
As you can see, java remains the faster solution. Swift, even on this newer hardware, still has the tendency to drop 1.5% of requests.
Conclusion: use appropriate tech!
The number of requests your server can handle depends not only on the hardware, but also on the software technology.
Changing your software stack can pay off, if it means you can reduce your number of servers.
Especially if your application requires tens or hundreds of servers, it makes sense to take this into account when deciding on your technology stack.
References
All my used code is in this serverbench repository
I gave a talk about this subject during the Appril Festival 2024, at Pinch Amsterdam.
An expansive discussion about the irregularities of this Vapor benchmark is discussed in the swift forums
Thanks
I would like to thank Jelle Luteijn and Gerard de Leeuw from ColoClue for their help with the benchmarks. Also many thanks to Jeroen Vermeulen of Cisco for making this post more readable and concise.